AS Level Economics 9708
4. The macroeconomy
Written by: Adhulan Rajkamal
Formatted by: Adhulan Rajkamal
Index
4.1 National income statistics
- National income → A country’s total output
- Income earned by producing output
- Income spent on consuming output
- This means total output = total income = total expenditure
🔥 What if some income is not spent but saved?
If income is saved, total expenditure may be less than total income in the short run
However, in a balanced economy, savings are eventually invested, restoring the equality of total output = total income = total expenditure
GDP & GNI
Gross domestic product (GDP)
- Most widely used measure of national income
- “Gross” → Total; “domestic” → home economy; “product” → output
- India’s GDP is a measure of the total value of output produced by the factors of production based in India in a year
Gross national income (GNI)
- GNI → GDP + net income from abroad
- GNI changes the focus from output produced in a country to income earned by the country’s residents and firms regardless of where it is earned
- Sources of income included in GNI:
- Net property income from abroad
- Receipts of profit, rent and interest earned on the ownership of foreign assets minus the payments of profit, rent and interest to non-residents
- Net receipts of compensation of employees
- Wages earned by workers who are resident in one country but who work abroad for short periods (less than a year) – includes seasonal and cross-border workers
- Net taxes less subsidies on products
- Some tax revenue on products may go to other countries or international organizations, while some production subsidies may come from them
- Eg: Germany pays some of its tax to the European Union and also receives some production subsides
- Net property income from abroad
Gross national disposable income
- GNI + income sent home to relatives by people working abroad (non-residents) minus income sent by foreigners working the country to their relatives abroad (net remittances)
GDP vs GNI
- Most countries’ GDP and GNI are similar
- However, there’s significant differences in a few countries
- Ireland has a higher GDP than GNI → MNCs and foreign workers make and important contribution to output
- Germany has higher GNI than GDP → net inflow of property income from abroad (high level of foreign investment)
🔥 Foreign investments
Foreign investment may increase GDP but reduce GNI due to net outflow of profits and other income
Methods of measuring GDP
- There are 3 ways of measuring GDP:
- Output method
- Income method
- Expenditure method
- All methods should give same value of output because they all measure the circular flow of income
The output method
- Measures the value of output produced by industries (sometimes called the production method)
- Important to avoid double counting → Total output by automobile manufacturers + total output by tyre manufacturers will result in double counting of the value of tyres.
- Measuring the total value of final goods and services (OR)
- Adding the value added at each stage of production → value added is the difference between the selling price and the price of goods and services used in production
The income method
- Value of output produced is based on the costs involved in producing that output
- The costs include → wages, rent, interest and profits (income paid to factors of production)
- Only payments received in return for providing a good or service must counted (income from transfer payments not included)
The expenditure method
- Calculated by adding up consumer expenditure, government spending on goods and services, total investment, changes in stocks and the difference between exports and imports
- Transfer payments are not included
- Note → Government spending on welfare payments does not represent spending on goods and services
- What is produced in a year will either be sold or added to stock → so if additions to stocks are added to expenditure on goods and services, the measure will equal output and income
- Sales of exports represent the country’s output and creates income in the country (so must be added)
- Expenditure on imports represents the output and income of a foreign country (must be deducted)
Market prices and basic prices
- GDP and GNI are measured in both market price and basic prices
- Market prices → Prices paid by consumers; they take into account indirect taxes and subsidies
- Basic prices → Prices charged by producers before the addition of indirect taxes and the deduction of subsidies (also known as factor cost)
- Equals the total income paid to the factors of production for making the output
Gross values and net values
- Gross investment → Total spending on capital goods
- Includes output of capital goods both used to replace existing capital goods that have worn out or become out of date due to advances in technology and capital goods used to expand capacity
- Net investment → Additions to the capital stock
- Deducts the value of capital goods used for replacement of old capital goods from gross investment (this value is referred to as depreciation or capital consumption)
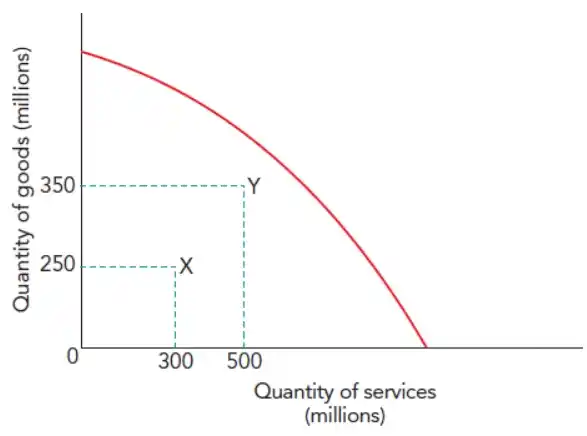
- Indicates whether the country’s ability to produce goods and services (PPC) in the future will increase
- GDP and GNI include gross investment
- NDP (Net domestic product) and NNI (Net national income) only include net investment
4.2 Introduction to the circular flow of income
- Shows how income, spending and output move around an economy
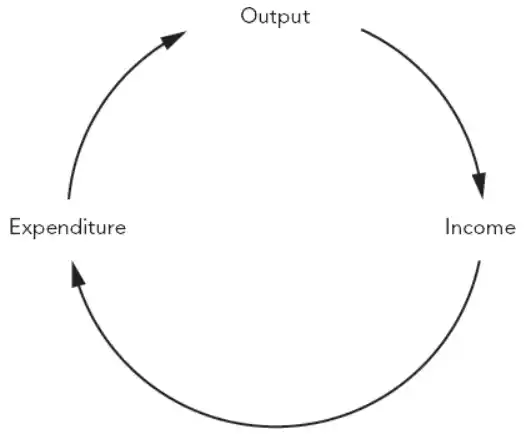
- Output generates income which is then spent on the output
Closed and open economy
- Open economy → Takes part in international trade
- Closed economy → Does not trade with other countries (practically, no economy is totally closed)
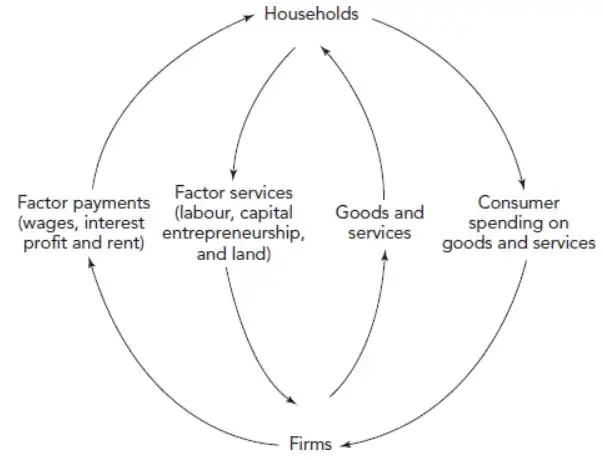
Circular flow in a closed economy
- The circular flow of income in a closed economy:
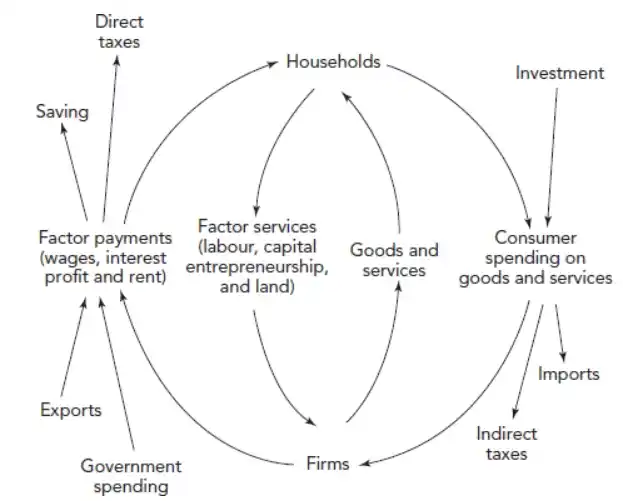
Injections and leakages on the circular flow
- Injections → Additions to the circular flow of income
- Investments
- Government spending
- Exports
- Leakages/ Withdrawals → Withdrawals from the circular flow of income
- Savings
- Taxes
- Imports
- The circular flow of income in an open economy:
Equilibrium and disequilibrium income
- For income to be unchanged → injections = leakages
- Injections > leakages → extra spending in the economy, causing income to rise
- Leakages > injections → more spending will leave the circular flow, and income will fall
- Equilibrium income in a closed economy without a government (only households and firms)
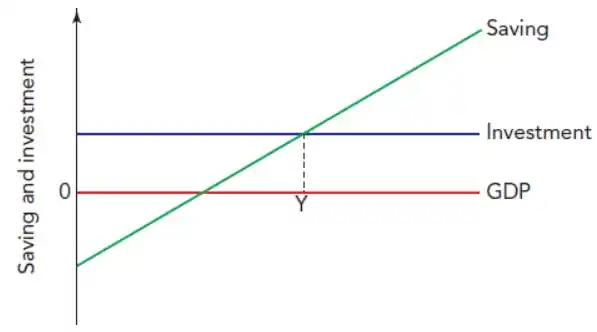
Y is equilibrium national income
- In Keynesian theory, investment is often treated as autonomous in the short run – does not depend on GDP
- Savings are positively correlated with GDP because individuals save more when their income rises
- A rise in investment (injection) will increase GDP (national income); a fall in savings (leakage) will also increase GDP
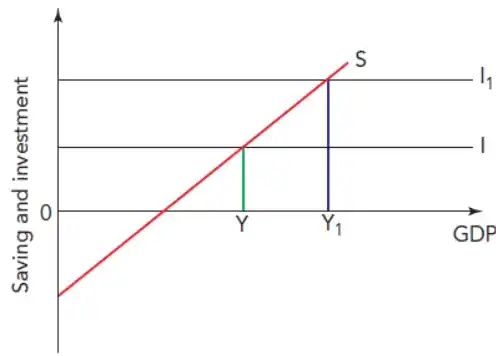
- Investment increases first (autonomous)
- GDP rises due to the multiplier effect – people get additional income
- Savings rise because people save a part of their additional income → new equilibrium reached
- Equilibrium income in a four-sector model (households, firms, the government and the international economy)
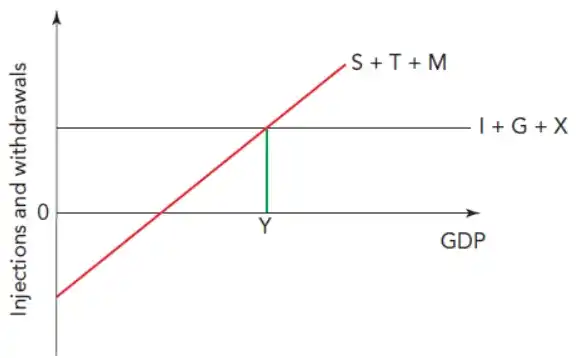
- Leakages → (S) Saving; (T) Taxes; (M) Imports
- Injections → (I) Investment; (G) Government spending; (X) Exports
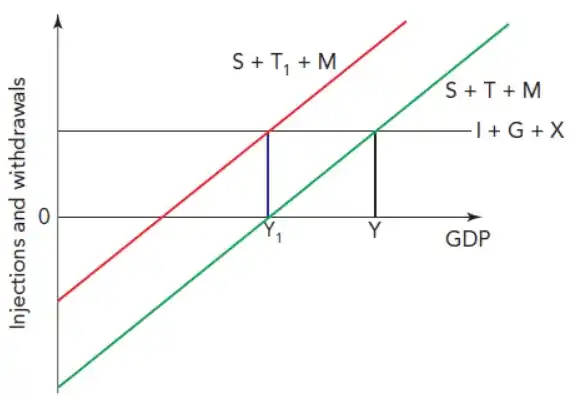
- Effect of an increase in taxation without a change in government spending on income equilibrium
4.3 Aggregate demand and aggregate supply analysis
- Aggregate demand (AD) → The total demand for an economy’s goods and services at a given price level in a given time period
- AD = C + I + G + (X-M)
- (C) Consumer expenditure → Spending of households on goods and services (consumption)
- (I) Investment → Spending by private sector firms on capital goods (primarily through borrowing)
- (G) Government spending → Government spending on goods and services (does not include transfer payments)
- (X-M) Net exports → Difference between the value of exports and the value of imports of goods and services
Determinants of the components of AD
Consumer expenditure
- The main influence on consumer expenditure → Level of disposable income
- Dissaving → Consumer expenditure exceeds income, with people or countries drawing on past savings, or borrowings
- Saving → Disposable income minus consumer expenditure
- Other determinants:
- Distribution of income →When income is more equally distributed, consumer expenditure rises because low-income individuals spend most of their additional income, while the rich are less likely to reduce spending when their income falls
- Rate of interest → More spending when interest rates are low, since, return from saving is reduced
- Availability of credit → When availability of credit is high, spending is also high
- Expectations → However, people will not borrow if their expectations about future economic prospects are pessimistic
- Wealth → More wealth, more spending
Investment
- Includes private sector spending by firms on capital goods, such as factories, offices, machinery, etc.
- Determinants;
- Consumer demand → As demand rises firms will likely buy more capital equipment to expand their capacity
- Rate of interest → A lower rate of interest, lowers cost of investing – firms that borrow will find it cheaper and firms that use retained profits will have lower opportunity cost for investment
- Technology → Advances in technology will raise the productivity of capital goods, making them more attractive
- Cost of capital goods → Lower the price of capital goods, more the investment
- Expectations → When firms are optimistic that economic conditions are improving and demand for their products will rise – more investment
- Government policy → Lower corporate tax will motivate firms to expand production
Government spending
- Includes expenditure on providing merit goods (education and healthcare) and public goods such as defence
- Determinants:
- Government policy → expansionary vs contractionary policy
- Tax revenue → Greater tax revenue, more likely to spend more
- Demographic changes → Pressure for a rise in government spending may come from an increase in the number of children (education) and/or an increase in the number of elderly people (healthcare)
Net exports
- Determinants:
- GDP of the country and foreign countries → As GDP increases, the demand for imports usually rises – some products may also be diverted from the export market to the domestic market. When income rises abroad, demand for exports increases.
- Relative price and quality competitiveness of the country’s product → Improved competitiveness due to improved productivity or marketing will result in increased exports
- Exchange rate → When exchange rate falls in value, exports become chapter and imports become expensive – if PED for exports and imports is elastic, export revenue will rise while import expenditure will fall
Aggregate demand curve
- The downward sloping nature of the AD curve:
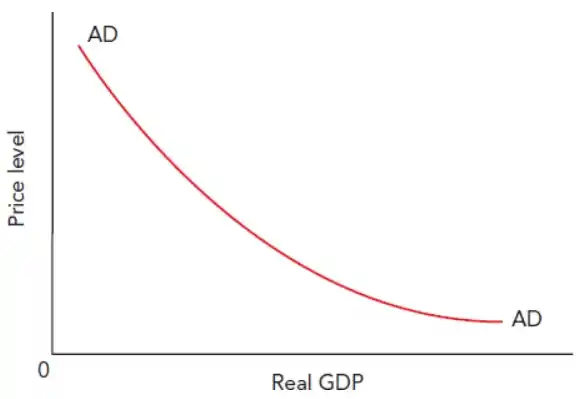
- Demand curve for a product → Price of the product is changing but it is assumed that the prices of other products have not changed (ceteris paribus)
- AD curve → Prices of most products are changing in the same direction
- As price level increases → contraction in AD; a fall in price level → extension in AD
- Why does AD fall when price level rises:
- Wealth effect: A rise in price level will reduce the amount of goods and services that people’s wealth can buy. The purchasing power of savings and other assets will fall
- International effect: Rise in price level will reduce demand for net exports → exports become less price competitive while imports become more price competitive
- Interest rate effect: Rise in price level will increase the demand for money to pay the higher prices → this will increase the interest rate → reduction in consumption and investment
Shifts in AD curve
- Non-price level influence causes AD to change (whole curve will shift)
- Non-price level influences → changes in the component of AD (C + I + G + (X-M))
Aggregate supply
- AS → Total planned supply of all the producers in the country
- Short-run aggregate supply (SRAS) → The total output of an economy that will be supplied when there has not been enough time for the prices of factors of production to adjust to changes in AD and price level
- Long-run aggregate supply (LRAS) → prices of factors of production have fully adjusted to changes in AD and price level
- SRAS:
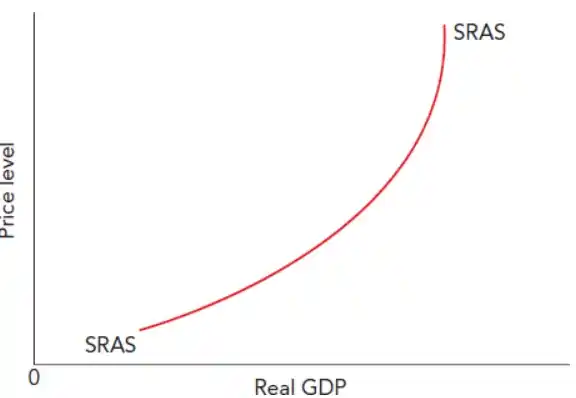
- Reasons for the shape of the SRAS curve:
- Profit effect: As the price level increases, the prices of factors of production such as wages do not change, so profit increases – incentive to produce
- Cost effect: Wage rates, raw material costs, and input prices are assumed constant. However, average costs may increase as output rises due to factors like overtime payments and recruitment costs. To cover these rising costs, producers will demand higher prices (short run)
- Misinterpretation effect: Producers may confuse changes in the price level with relative changes in prices- assuming demand for their products has increased, they begin to produce more
Shifts in the SRAS curve
- Change in price of factors of production: Rise in wage rates, not matched by a rise in labour productivity → decrease in SRAS
- Change in taxes on firms: Reduction in corporate tax → increase in SRAS
- Change in factor productivity/quality of resources: Increases AS in both short run and long run
- Change in quantity of resources: In the short run the supply of inputs may be influenced by supply-side shocks (eg. natural disasters). No significant impact in the long run
Shape of LRAS curve
- LRAS curve → shows relationship between real GDP and price level when there has been time for input prices to adjust to changes in AD
🔥 Enough time for input prices to adjust” means that in the long run:
Wages, raw material costs, and other input prices are fully flexible.
They adjust to changes in Aggregate Demand and the price level.
As a result, real GDP depends on the economy’s productive capacity (technology, labour, and capital), not on price changes.
The Keynesian LRAS curve
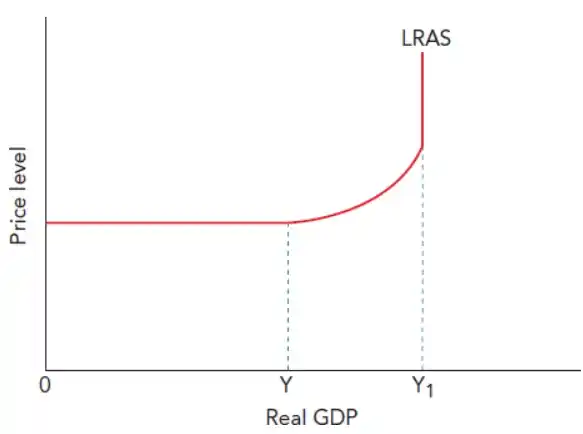
- In the long run, an economy can operate at any level of output and not necessarily at full capacity
- 0 to Y output can be increased without increasing the price level
- When output, hence employment are low, firms can attract more resources without raising their prices (there is time for input prices to change, but due to low level of AD they do not)
- For example, when unemployment is high → job offer is sufficient to attract new workers
- Y to Y1 firms begin experiencing shortage of input and bid up wages, raw material prices and prices of capital equipment
- At Y1 the economy is producing at its maximum
New classical LRAS curve
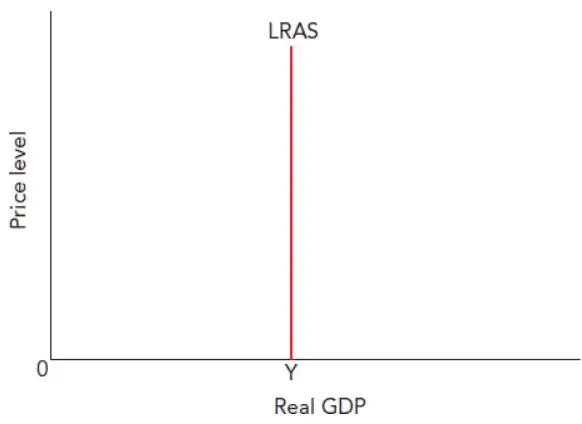
- In the long run the economy will operate at full capacity
- A rise in AS may increase output in the short run by encouraging firms to more intensive use of their existing resources → workers may asked to work overtime and capital equipment may be operated for long periods
- In the long run the more intensive use of resources will raise costs of production → economy will move onto a new SRAS curve (decrease in SRAS) → output will return to initial level
- New classical economists believe the long run is the sum of short runs
🔥 Tip
The distinction between the Keynesian and new classical school versions of the shape of LRAS curve can be used as an evaluative point.
Eg: Discuss whether a rise in aggregate demand will cause inflation
Shifts in the LRAS curve
- Change in quantity and/or quality of resources (factor productivity)
- Example for changes in quantity: net immigration, increase in retirement age, more women entering the labour force, net investment (gross investment exceeds depreciation), discovery of new resources, land reclamation
- Main reasons for changes in quality:
- Improved education and training
- Improved healthcare
- Advances in technology
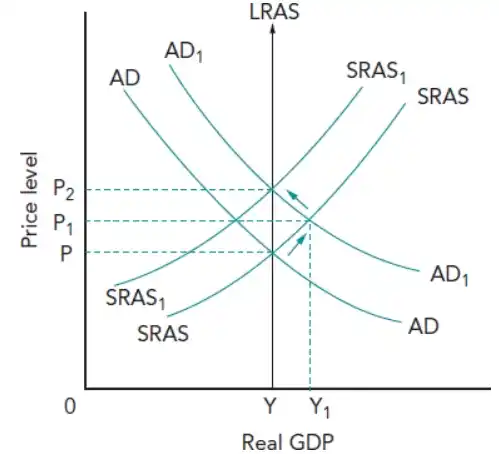
🔥 Macroeconomic equilibrium
The output and price level achieved where AD equals AS.
Changes in some variables, like investment, net immigration and government spending on education, causes shifts in both AD and A.
4.4 Economic growth
- Economic growth (increase in output) → key macroeconomic performance indicator
- Measured in terms of changes in real GDP
- Output increase > Population growth → increase in GDP per head (per capita)
- Economic development → An increase in welfare and quality of life; distinct from economic growth
- Assessing economic development involves normative judgements
Nominal GDP and real GDP
- Nominal (or money) GDP → Total output measured in current prices (not adjusted for changes in price level); sometimes referred to as GDP at current prices
- Real GDP → Total output measured in constant prices (prices in a base year)
- Price index → A way of comparing changes in the price level over time. The value of the base year is set to 100 and the value of each following year is a % of it.
- Calculating real GDP:
$$\text{real GDP} = \text{nominal GDP} \times \frac{\text{base year index}}{\text{current year index}}$$
Causes and consequences of economic growth
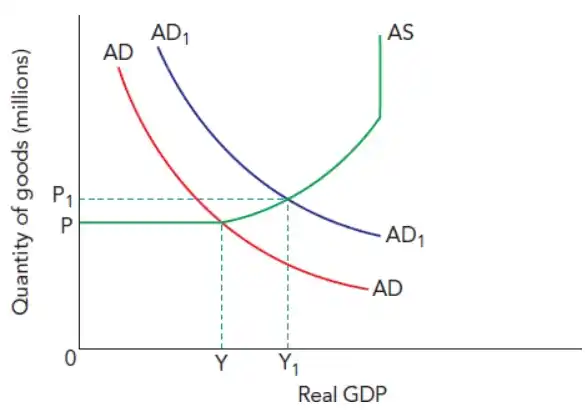
- If there is spare capacity → Economic growth can be achieved with increase in AD
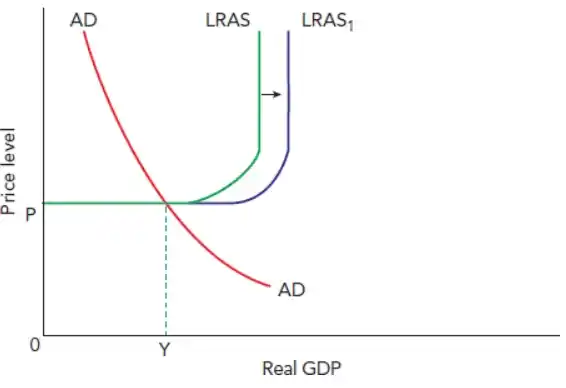
- Increase in AS → leads to long and sustained economic growth
- AS can be increased due to increase in the quantity of resources and quality of resources
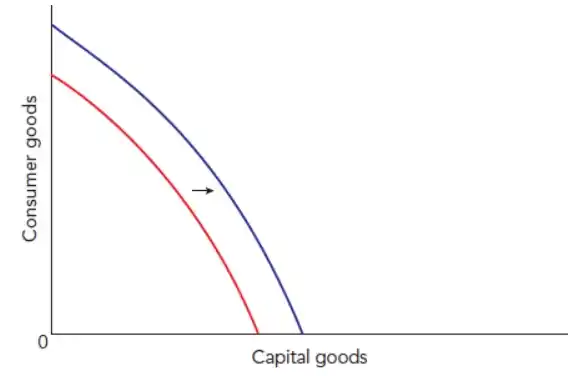
- For an increase in productive capacity to lead to higher output → additional productive capacity must be used
- Recession → Decline in real GDP over two consecutive quarters or more
Costs of economic growth
- If economy is operating at full capacity → opportunity cost involved in achieving economic growth – resources must be allocated from consumer to capital goods – temporary fall in living standards
- Economic growth results in structural changes (some industries declining and some expanding) → causes stress and anxiety
- Increased working hours
- Depletion of natural resources and damage to the environment
Benefits of economic growth
- Increase in availability and consumption goods and services → increase in living standards
- Increased tax revenue → can be spent on the poor
- Rise in employment
- Stable growth increases business and consumer confidence → encourages investment
- Increase in international prestige and power
4.5 Unemployment
- Unemployment → occurs when people who are willing and able to work cannot find a job (actively seeking a job)
- Labour force → People who are willing and able to work – includes both employed and unemployed who are actively seeking employment
- Economically inactive → People who are not working and trying to find employment. They are not part of the labour force.
- Economically active → Anyone in the labour force is economically active
- Underemployment → Situation where people are working fewer hours than they would like or working in jobs that they are overqualified for
The labour force
- The size of a labour force depends on demographic, economic, social and cultural factors:
- School leaving age
- Number of people who remain in full-time education above the school leaving age
- Retirement age
- Proportion of women who join the labour force
- Labour force participation rate → The proportion of the working-age population in the labour force
Level and rate of unemployment
- Level of unemployment → The number of workers who are unemployed
- Unemployment rate → Unemployed workers as a % of the labour force
- Employment rate → Employed workers as a % of the working age population
- Discouraged worker → Worker who would like a job but who has given up actively seeking work
- Reasons why people may enter of leave unemployment:

Measuring unemployment
- Governments use two main methods of measuring unemployment:
- Claimant count measure → based on those claiming unemployment benefits
- Labour force survey measure → based on a survey
Claimant count
- Relatively cheap and quick to calculate
- May not be entirely accurate → may overstate or understate
- Include people who are not really unemployed → people who are not actively seeking employment; some may be working and claiming benefits illegally
- Omit some people who are genuinely unemployed → people who are too young or old to claim benefits; people who do not claim benefits by choice; people whos non-employment income is too high
Labour force survey
- More widely used than claimant count
- Survey taken based on the definition of unemployment as set by the International Labour Organisation (ILO)
- Makes international comparison easier
- It picks up some groups of people not included in the claimant count
- Time consuming and expensive to collect and are subject to sampling error
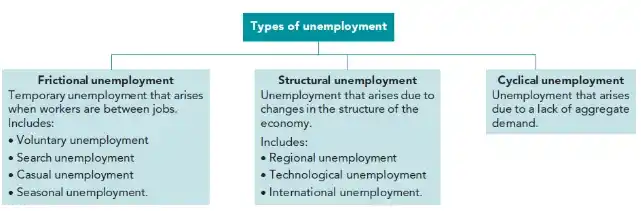
Causes of unemployment
- Unemployment → 3 main types:
- Frictional unemployment
- Structural unemployment
- Cyclical unemployment
Frictional unemployment
- Temporary unemployment arising when workers are in-between jobs
- Temporary unemployment → Unemployment resulting from the unemployed choosing not to accept jobs at the going wage rate
- Influenced by how level of unemployment benefits compares to low wages
- Search unemployment → Unemployment that exists when people take time looking for a job they are willing to accept
- Casual unemployment → workers who are out of work between periods of employment (Eg: actors, construction workers)
- Seasonal unemployment → Unemployment arising at particular times of the year due to fall in demand for a product or service
Structural unemployment
- Arises due to changes in the structure of the economy – leading to mismatch between job vacancies and skills, qualifications, experience and geographical location
- Some industries decline while others grow
- Methods of production change
- If workers are unable to move from one industry to another due to lack of geographical or occupational mobility → structural unemployment
- Structural unemployment can take a number of forms:
- Regional unemployment → Declining industry may be concentrated in a particular area
- Technological unemployment → Introduction of labour saving-techniques (eg: usage of capital goods)
- International unemployment → Job loss when demand switches from domestic industries to more competitive foreign industries
Cyclical unemployment
- Frictional and structural unemployment → largely due to supply side problems
- Cyclical unemployment → demand-deficient unemployment (lack of AD)
- Affects whole economy
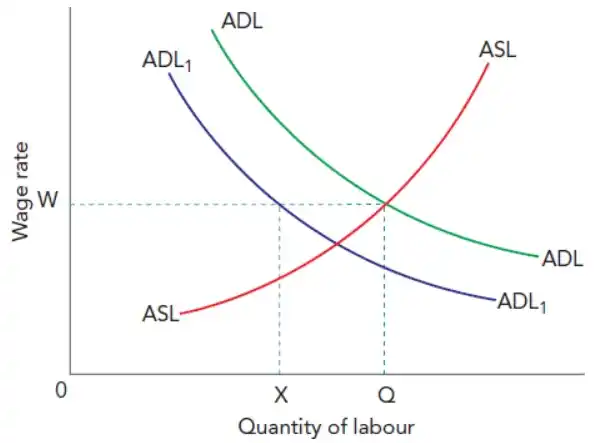
- Fall in AD → firms reduce output → fall in demand for labour
- If workers resist wage cuts, demand-deficient unemployment XQ will exist
4.6 Price stability
- Price stability → A low and stable inflation rate
- Price level → The average of all price in an economy
- Inflation → A sustained increase in an economy’s price level over a period of time
- Disinflation → A fall in the inflation rate
- Creeping inflation → Low rate of inflation
- Hyperinflation → Very high rate of inflation, which may result in people losing confidence in the currency
- Deflation → A sustained fall in the price level
Calculating the inflation rate
- Two most used comparisons for inflation rate:
- Annual average method → Compares the average level of prices during a 12-month period with the average price level in the previous 12-month period
- Year-on-year method → Compares the price level of one month with that same month of the previous year
- Calculation of inflation rate (June 2021 price level = 120; June 2022 price level = 126):
$$\frac{6}{120} \times 100 = 5\%$$
Measurement of inflation and deflation
- Consumer price index (CPI) → Used to assess changes in cost of living
- Steps to constructing a CPI:
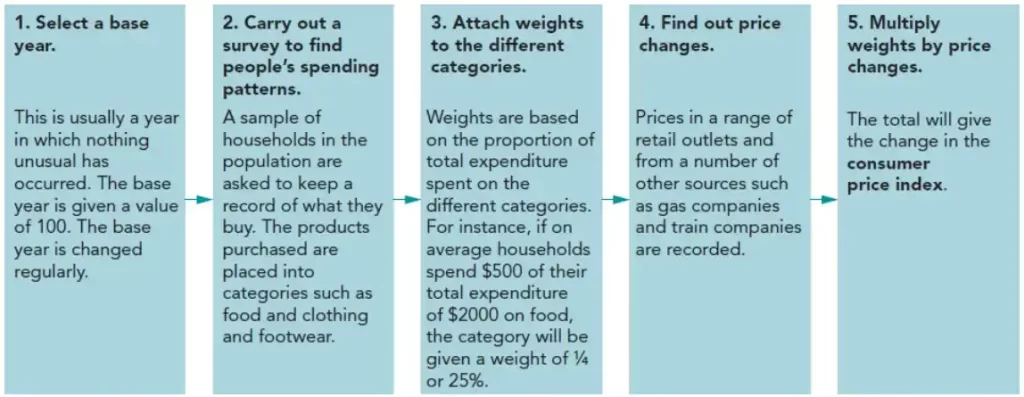
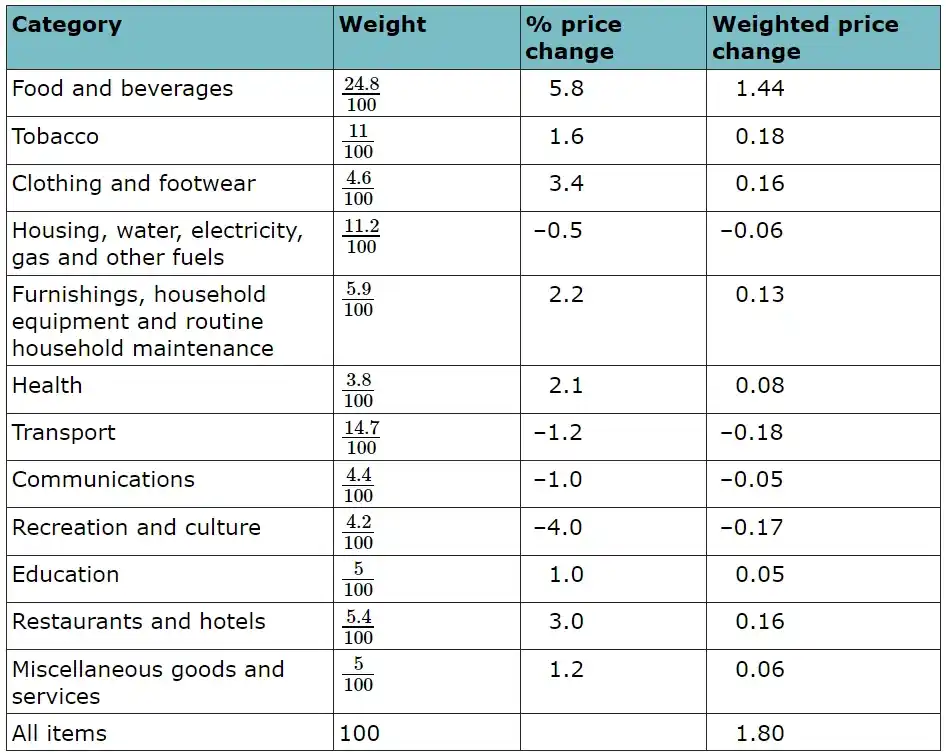
- Example CPI:
Difficulties in measuring changes in price level
- Base year → Difficult to select base year (nothing unusual or anomalous should have happened in that year)
- Survey → Is the sample representative of the entire population; is the survey completed accurately
- Basket of goods and services:
- Basket of goods and services and their weighting may become out of date
- Quality bias: When a product’s price increases, part of that increase may be due to an improvement in the product’s quality, not just inflation (government seek to solve this by assigning monetary value to changes in quality)
- Substitution bias: occurs because the CPI’s fixed basket approach ignores consumers’ ability to substitute goods when prices change
Money value and real data
- Money values (or real values) → Values at the prices operating at the time
- Real data → Date adjusted for inflation
- Convert money value to real value:
$$\text{real value} = \text{money value} \times \frac{100 \, (\text{base year price index})}{\text{current year price index}}$$
Causes of inflation
Cost-push
- Occurs when prices are pushed up by increased in the cost of production
- Reasons:
- Wages may increase more than labour productivity → rise in labour costs
- Rise and fall in exchange rate
🔥 Wage-price spiral and inflationary spiral
Wage-price spiral → Higher wages causing prices to rise → wages rise even more due to increase in price level → and so on [COST PUSH]
Higher wages → higher spending → increase in AD [DEMAND PULL]
Inflationary spiral → Cost-push and demand-pull continuously reinforcing each other
Demand-pull
- Increase in any component of AD, without equal increase in AS → demand-pull inflation
- Greater impact when economy is operating in full capacity
- Some changes may increase AD and reduce AS (by increasing cost of production)
- Eg: fall in countries foreign exchange
Consequences of inflation
Costs of inflation
- A reduction in net exports
- Unplanned redistribution of income → Borrowers will gain, savers and lenders will lose
- Menu costs → costs involved in changing prices
- Shoe leather costs → costs involved in moving money from one financial institution to another in search of highest interest rate
- Fiscal drag → Income levels corresponding to different tax rates are not adjusted in line with inflation – people and firms are dragged into higher tax brackets
- Inflationary noise (also called “money illusion”) → Consumers and firms confuse inflation for price signals; makes it difficult to assess what is happening to relative prices
- Loss in confidence
- More inflation → inflationary spiral
Potential benefits of inflation
- Stimulates output → low and stable inflation rate caused by increasing AD will motivate firms
- Reduces burden of debt
- Prevents some unemployment → since inflation reduces the real cost of labour
Factors affecting the consequences of inflation
- Cause of inflation → Demand-pull inflation is less harmful than cost-push inflation
- Rate of inflation
- Whether it was an expected or unexpected inflation rate
- How the rate compares with competing countries – affects export competitiveness