AS Level Economics 9708
2. The price system and the microeconomy
Written by: Adhulan Rajkamal
Formatted by: Adhulan Rajkamal
Index
2.1 Demand and supply curves
Price mechanism and markets
- Price mechanism sends out signals from consumers to producers in the form of changes in prices
- Oversupply → prices fall – consumers are sending a signal that lesser resources should be allocated to the product
🔥 Consumers
Individuals or households who buy goods and services for their own use or for others
- Price mechanism is self regulating – does not require any involvement from the government while the mechanism is working efficiently
- Market: Where buyers and sellers get together to trade
Demand
🔥 Definition
Demand refers to the quantity of a product that buyers are willing and able to buy at different prices per period of time, ceteris paribus.
Breakdown of the definition:
- Quantity → Numerical amount of product demanded
- Product → Refers to items being traded. Includes goods, services and other tradables like stocks and currency
- Buyers → Often referred to as consumers (they may also be a firm that is part of a supply chain)
- Willing to buy → Buyers must want a product if they are going to enter a market with the intention of buying – this is called notional demand
- Able to buy → the notional demand for a product must be backed by purchasing power in order to convert demand to effective demand
- Different prices → quantity demanded varies depending on the price, with lower prices leading to higher demand and higher prices leading to lower demand, ceteris paribus (Law of demand).
- Per period of time → demand is measured over a specific time frame (day, week, month or year)
- Ceteris paribus → since many factors can influence the demand for a product (like income, tastes, or prices of related goods), we simplify the analysis by assuming these factors stay unchanged, allowing us to focus solely on the effect of price on demand.
The demand curve
- The definition of demand can be represented by a curve → Demand curve (D)
- Market demand → The total amount of a good demanded by consumers in its market
- Market demand schedule → The data from which a market demand curve is drawn on a graph
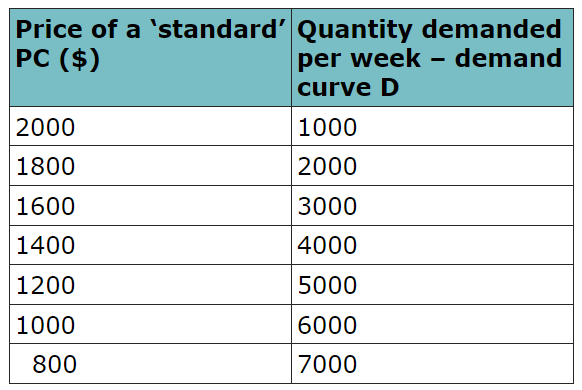
- Collecting real-world data for a demand schedule is tough – especially when there are a wide range of prices to consider
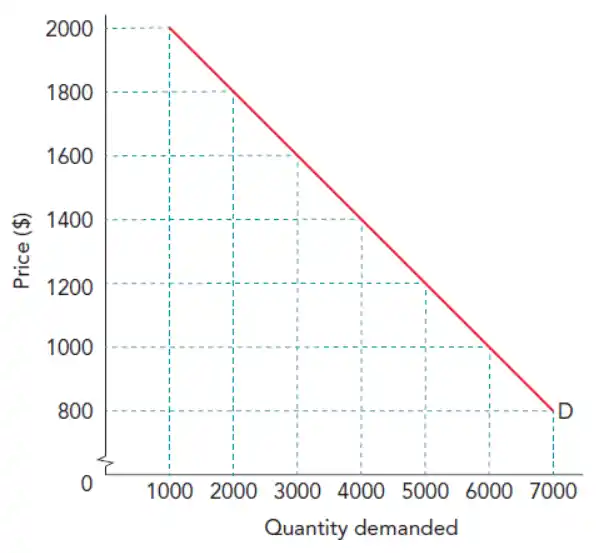
- The market demand curve can be plotted using the demand schedule containing market demand at different prices
- The market demand curve represents the aggregation of the individual demand curves of all the buyers in the market
🔥 Demand vs Quantity Demanded
Demand refers to the entire curve (does not change when the price of the product changes)
Quantity demanded changes with price
Determinants of demand
- Income (disposable income to be specific, aka income after tax)
- Ability to pay is vital when considering effective demand
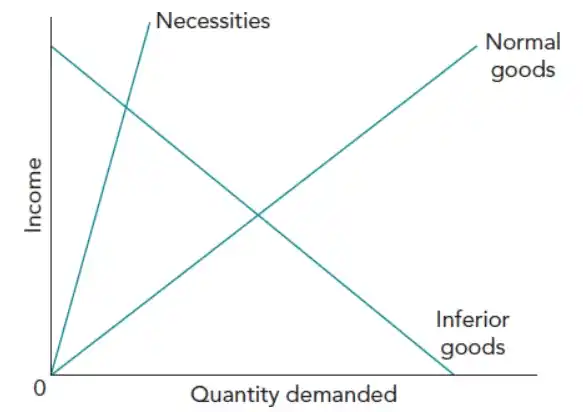
- Goods and services for which increase in income leads to increase in demand → Normal goods
- Eg: Cars, housing, restaurant meals etc.
- Most goods are normal goods
- Goods and services for which increase in demand lead to decrease in demand → Inferior goods
- Poor quality food items, used clothing, etc.
- Price and availability of related goods
- Substitutes → Alternative goods that satisfy the same want or need.
- Compliments → Goods that have a joint demand as they add satisfaction
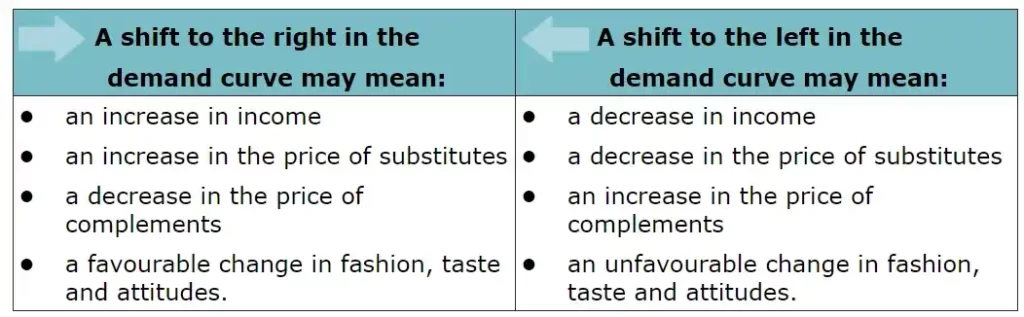
- Fashion, taste and attitudes
- Income (disposable income to be specific, aka income after tax)
- Ability to pay is vital when considering effective demand
- Goods and services for which increase in income leads to increase in demand → Normal goods
- Eg: Cars, housing, restaurant meals etc.
- Most goods are normal goods
- Goods and services for which increase in demand lead to decrease in demand → Inferior goods
- Poor quality food items, used clothing, etc.
- Price and availability of related goods
- Substitutes → Alternative goods that satisfy the same want or need.
- Compliments → Goods that have a joint demand as they add satisfaction
- Fashion, taste and attitudes
Supply
🔥 Definition
Supply refers to the quantity of a product that suppliers are willing and able to sell at different prices over a period of time, ceteris paribus
- The definition of supply can be represented by a curve → Supply curve (S)
- Collect data about the selling intentions of all suppliers in a market and create a market supply schedule
- Plot the curve using the market supply schedule
Factors affecting supply
- Costs
- The cost of production and distributing the good affects profit and therefore willingness to supply
- Size and nature of industry
- If the industry is a sunrise industry – supply will gradually increase → but entry of new firms may increase competition and cause a fall in prices
- Supply can be deliberately restricted to keep up prices (in the cases of monopoly)
- Change in price of
- If competitor lowers price, then less will supplied by the firms which keep their price unchanged
- Government policy
- A new tax may decrease supply
- A subsidy may increase supply
- State of technology
- Other factors
- Weather and other natural events such as draught and natural disasters
Shifts in the demand and supply curve
- Demand and supply curve is drawn in the assumption that except price, everything else is ceteris paribus
- When this condition is relaxed and non-price factors are allowed to influence the curve, the curves shift
- Causes of shift in demand curve:
- Causes of shift in the supply curve:
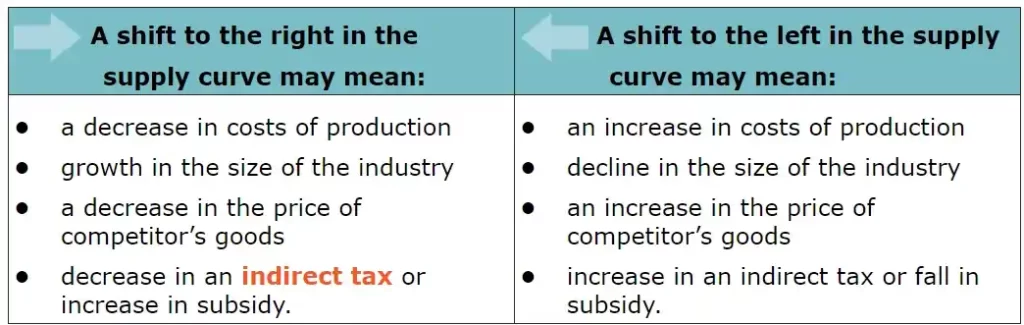
Movement along the curve
- A movement along the demand or supply curve shows how quantity demanded/supplied responds to a change in price
- Increase in quantity demanded/supplied → Extension of demand/supply
- Decrease in quantity demanded/supplied → Contraction of demand/supply
2.2 Price elasticity, income elasticity and cross elasticity of demand
- Price Elasticity of Demand (PED): measures of the responsiveness of the quantity demanded for a product to a change in the price of the product $$PED = \frac{\% \Delta \text{ in qty. demanded}}{\% \Delta \text{ in price}}$$
- Income Elasticity of Demand (YED): measures of responsiveness of the quantity demanded for a product to a change in income $$YED = \frac{\% \Delta \text{ in qty. demanded}}{\% \Delta \text{ in income}}$$
- Cross Elasticity of Demand (XED): measure of the responsiveness of the quantity demanded for product A to change in price of product B $$XED = \frac{\% \Delta \text{ in qty. demanded of product A}}{\% \Delta \text{ in price of product B}}$$
PED - Price Elasticity of Demand
Special PED values
- PED always negative (inverse relationship b/w price and demand) but only absolute value considered
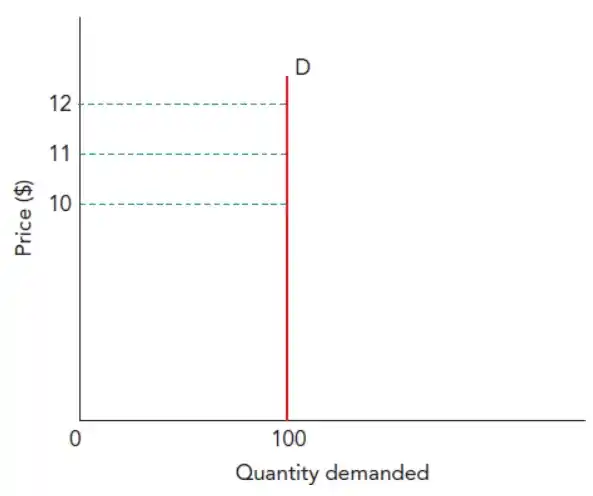
- PED = 0 → Perfectly inelastic:
- PED = (-)∞ → Perfectly elastic:
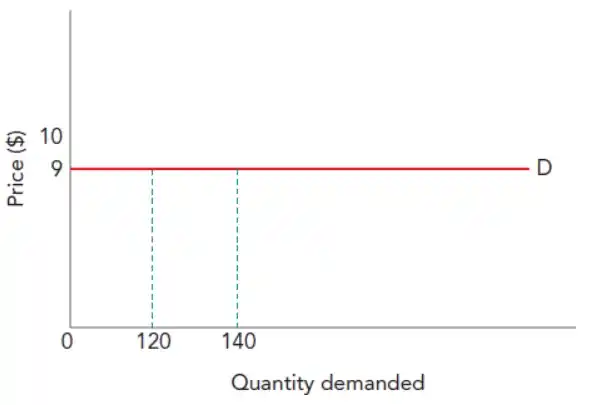
- All that is produced is sold at a given price
- PED = (-)1 → Unit elasticity:
Factors affecting PED
- Availability and attractiveness of substitutes
- No. of substitutes and closeness of substitutes
- Substitutability of products within the same group of products VS substitutability with goods from other product groupings
- One type of orange juice VS another type of orange juice → Substitutability within same group → High PED
- Fruit juices VS Fizzy drinks → Substitutability with goods from other product groupings → Low PED
- Narrower the definition of the market → greater the PED
- Other things to consider [EVALUATION POINTS]:
- Quality and extent to which information about products are available to customers (on the internet VS in a store)
- Extent to which people consider the product a necessity or a luxury
- Addictive. Habit-forming properties of the product
- Brand image of the product
- Relative expense of the product
- If proportion of income spent on the product is high, a change in price will have a great impact on purchasing power, therefore have high PED.
- Time period (long run vs short run)
- In the short run – hard to change spending patterns
- In the long run – if the price of the product goes up and stays up → people will find ways of adapting → PED will gradually increase
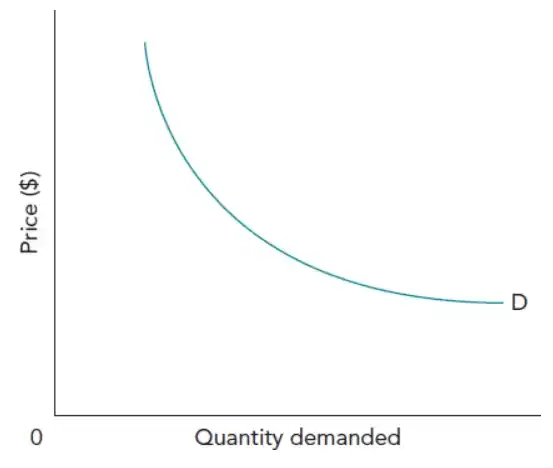
PED and a downward-sloping demand curve
- Remember PED is calculated in %change

YED - Income Elasticity of Demand
Classification of goods in relation to income
- Normal good: qty. demanded increases as income increases (YED > 0)
- Inferior good: qty. demanded decreases as income increases. Consumers replace goods with better quality alternatives. Eg: Poor quality rice, packet noodles. (YED < 0) → Greater magnitude, stronger relationship.
- Necessity good: qty. demanded is unlikely to change when income changes. Eg: Staple food. (YED is positive but very close to zero – suggests that there is a limit to how much a household consumes)
- Superior or luxury good: Normal good with a YED > 1
🔥 Refer to both magnitude and sign while answering
Cross elasticity of demand (XED)
- XED > 0 → The two goods are substitutes
- Greater magnitude → stronger substitute
- XED < 0 → The two goods are complements
- Greater magnitude → stronger complements
- XED = 0 → No particular relationship
🔥 Elasticity values are only estimates (EVALUATION POINT)
Due to problems associated with the collection of data!
How PED, YED and XED affect decision making
PED:
- Price variation in a market occurs due to PED variations over time: finals tickets have inelastic PED, while group stage tickets have elastic PED, leading to higher prices for finals tickets.
- Businesses should be aware of these changes in PED (Eg: during festive periods) and take advantage
- Total expenditure on a product
- Total expenditure = Price * qty.
- If PED is elastic → Increase in price leads to fall in total expenditure (% fall in demand in greater)
- If PED is inelastic → Increase in price leads to rise in total expenditure (% fall in demand is lesser)
- Objective of firms → Make the PED of their product more price inelastic
- Persuasive advertising
- Brand image
- Merger with competition to increase market share
- Monopoly market protected by a patent or regulation
- Note: Making a product more price elastic is tough
- Retailers use sales promotions to boost sales by lowering prices, hoping consumers continue post-promotion. This is risky: competitors may run similar promotions, causing losses for all.
YED:
- Important for governments and firms to forecast demand for a groups/ ranges of consumer goods and prepare accordingly – based on economic performance
- If cars are normal goods and income is increasing → government should divert resources to building roads
- Car companies should increase production capacity
- Evaluation point: YED loses accuracy in the long run as certain products and product ranges change technologically and therefore their YED too. Eg: smartphones 10 years ago vs now
XED:
- Firms are concerned about competitors’ pricing strategy → can study it using XED (higher the magnitude of XED the more vulnerable to competitor’s pricing) – substitutes
- Helps with bundled product offerings → identify most complementary goods and introduce a pricing structure to maximize revenue (Eg: Printer and ink-cartridges)
2.3 Price elasticity of supply
Price elasticity of supply (PES): a numerical measure of the responsiveness of the quantity supplied to a change in the price of the product, ceteris paribus (all other factors remain constant)
$$PES = \frac{\% \Delta \text{ in qty. supplied}}{\% \Delta \text{ in price}}$$- PES can be for individual business or entire market supply of an industry
- PES will always be +ve (+ve relationship b/w price and quantity supplied)
- PES > 1 → Price elastic supply
- PES < 1 → Price inelastic supply
- Perfectly elastic supply (PES = ∞):
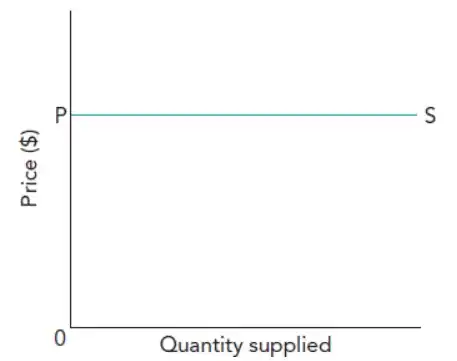
- Producer may only be willing to supply at one particular price
- Perfectly inelastic supply (PES = 0):
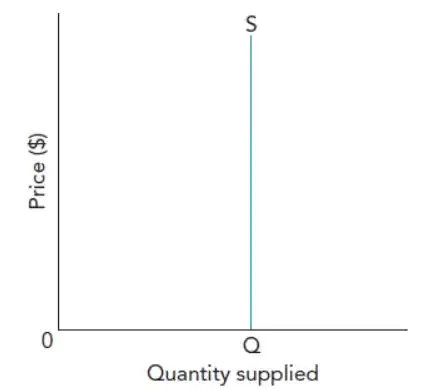
- It is not possible for the producer to change qty. Supplied; eg: flower production – perishable product, specific qty. must got to sale
Factors influencing PES
- Availability of stock
- Ease at which business can accumulate and reduce stock
- Stock allows to meet variation in demand through output changes rather than price changes
- Not applicable to services like airlines or stadiums → cannot increase the capacity of a flight or stadium in the short run (cannot maintain stocks)
- The time period
- In the short run, business with spare production capacity have higher PES
- However, shortages of critical factor inputs (like skilled labor) might reduce PES
- Depends on the industry – agriculture has inelastic PES in the short run – takes one growing season to switch crops
- In the short run, business with spare production capacity have higher PES
- Productive capacity
- In the long run, firms may increase productive capacity by investing in capital and taking advantage of technological advances
- In the long run, more businesses can enter and leave the market – hence productive capacity of the industry is flexible
Implications of PES
- PES used to explain the speed and ease with which business can adapt to the changing market conditions
- Manufactured goods generally have higher PES than agricultural goods
- Small change in market conditions, big change in farmer’s income
- Affects the stability of the market
2.4 The interaction of demand and supply
Market equilibrium and disequilibrium
🔥 Definitions
Market equilibrium: is when the quantity supplied equals quantity demanded. This is a balanced situation with no tendency to change, ceteris paribus.
The price mechanism makes sure that the market clears.
Market disequilibrium: A situation when demand and supply are not equal. Leading to shortage or excess. This is an unbalanced situation with a tendency to change, ceteris paribus.
- Equilibrium:
- Plans of consumers (represented by the market demand curve) and the plans of the suppliers (represented by the market supply curve) match
- Consumers and suppliers satisfied at equilibrium price and qty.
- Disequilibrium:
- Markets are not always in equilibrium (especially in the real world)
- Key feature of market mechanism → adjusts supply and demand to reach equilibrium position → efficient allocation of resources
- But some delays/lags always occur due to time taken to change production (especially in agriculture markets) – new equilibrium might not be reached immediately
- Total consumer expenditure = equilibrium quantity * equilibrium price
The effects of shifts in demand and supply curves on the equilibrium quantity
- Shifts in demand and supply curve occur due to non-price factors
- Shift in the entire demand/supply curve represent changes in demand/supply
- Movement along the curve represents change in qty. demanded/ qty. supplied
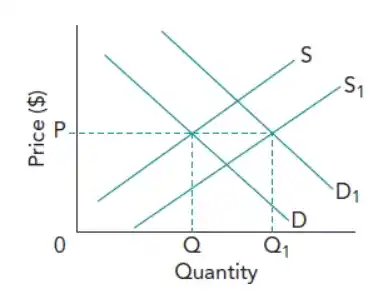
- The equilibrium position in a market is affected by a shift in the demand curve, a shift in the supply curve, or a combination of both. The outcome is disequilibrium leading to changes in price and quantity through workings of the free market mechanism
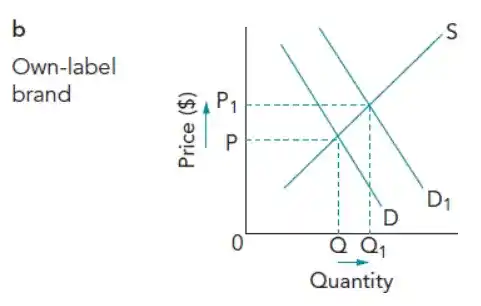
Relationships between markets
- Alternative demand
- A rise in the price of a good will lead to an increase in demand of its substitute

- Joint demand
- A good and its complement is jointly demanded. A fall in price of the good will lead to an increase in demand for the compliment

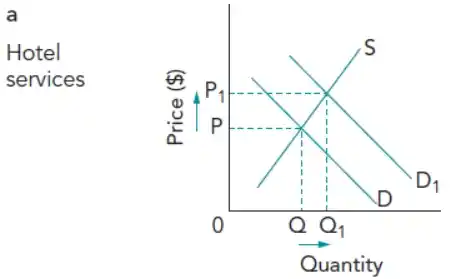
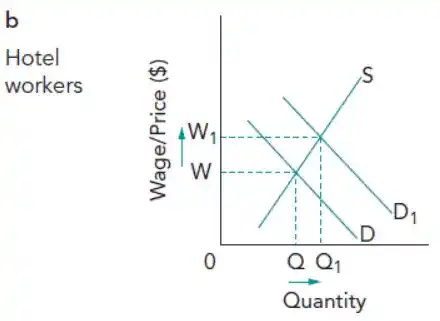
- Derived demand
- Applies where the product is required for the production of other goods/services. Eg: Labour → Demand for hotel workers is derived from the demand for hotel services
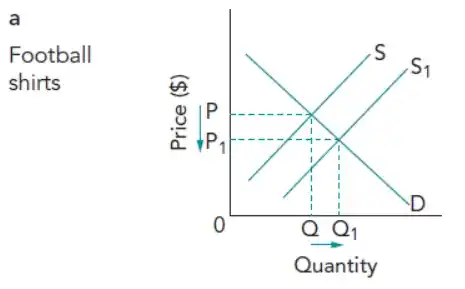
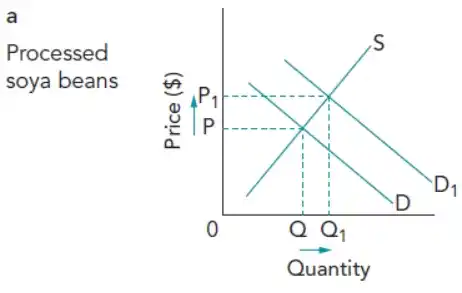
- Joint supply
- Occurs when two goods are produced together but for different purposes. Eg: Soya bean processing → crop first produced for human consumption and remainder is made into animal feed – both are jointly supplied

The functions of price in resource allocation
- Rationing
- Ration → limit; when producer limits supply of the products in the market to ensure that it remains exclusive
- It’s a process where the price system automatically limits the availability of certain products in the market.
- How it Works:
- High prices make products exclusive, limiting them to fewer consumers who are willing and able to pay.
- Ensures that demand remains in line with the limited supply
- Signaling and the transmission of preferences
- Consumers and producers take decisions based on price
- Rise in qty. demanded will cause a rise in the price – this will tell/signal producers to produce more
- The price mechanism producers to know the wants of the consumers – this is called transmission of preferences
- Incentivising
- Price acts as an incentive to both buyers and sellers
- Low prices and discounts incentivise buyers to buy more – since buyers are more satisfied
- Higher prices incentivise producers to produce more – profit incentive (continuous low price in the market will incentivise them to exit the market)
2.5 Consumer and producer surplus
Consumer surplus
🔥 Definitions
Consumer surplus: The difference between the price a consumer is willing to pay for a product and its market price
- Consumers who get maximum satisfaction – willing to pay highest
- But firms cannot charge different prices for different consumers based on their personal satisfaction
- When price increases, demand falls because price increase is greater than the satisfaction of some consumers → idea of consumer surplus
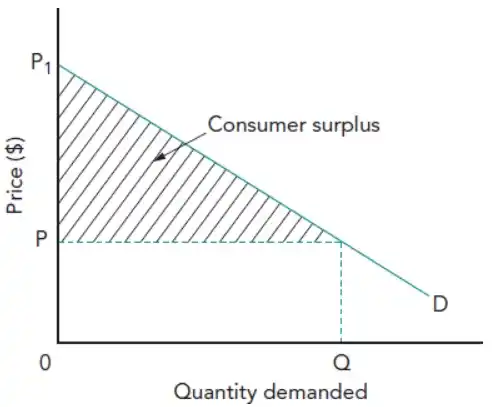
- Some consumers are willing to pay as much as P1 but they only pay P so they save P1-P → the area shaded shows the total saved by all the consumers
Impact of price change on consumer surplus
- The impact of price change on consumer surplus depends on:
- Extent of price change
- Price elasticity of demand
- If price increases, consumer surplus will fall more if PED is elastic:
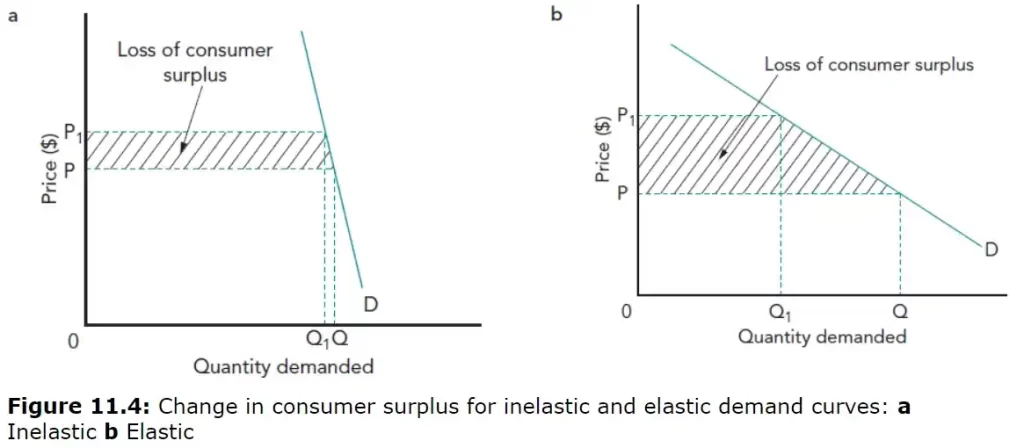
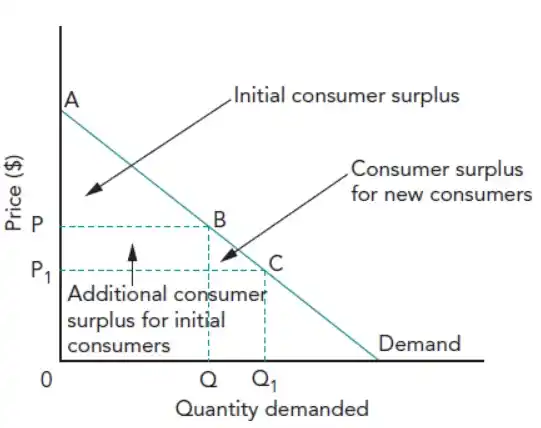
- Change in consumer surplus as price decreases:
Producer surplus
🔥 Definitions
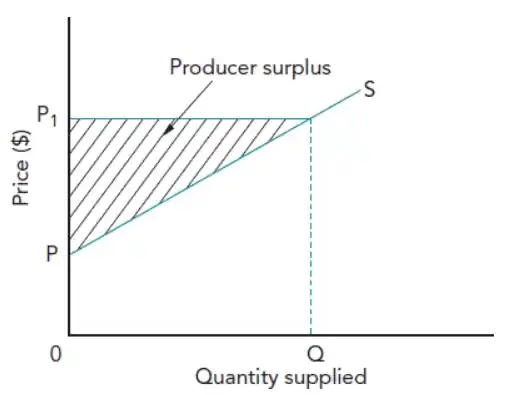
Producer surplus: The difference between the price a producer is willing to accept for a product and what is actually paid
- Producer surplus measures the extra revenue producers earn because the market price exceeds their minimum selling price:
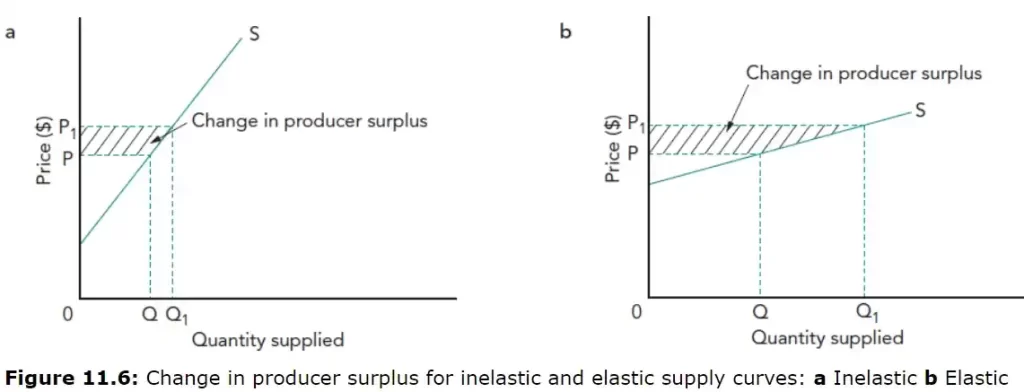
- The impact of price change in producer surplus depends on:
- Extent of price change
- PES
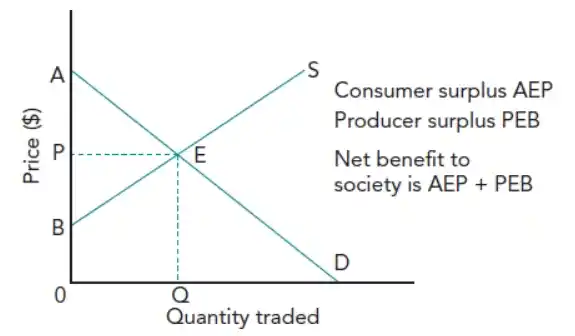
- Consumer surplus + producer surplus = net benefit to society of this market’s operations